CFD Results
The Final simulation
Hydrogen deflagration can be observed in this animation which was produced through our CFD Simulation using ANSYS Fluent 19 R2. This animation shows the temperarure of the flame as it deflagrates through the length of the duct. The reaction took approximately 0.0452 seconds until it was completed.
Temperature
The maximum temperature of the flame was found to be 1850.28K compared to 1319K which was found from experimental data. The accuracy of the experimental results cannot be confirmed without access to the official HYCOM data or experimental procedure. Therefore, a complete comparison of temperature cannot be carried out. The flame can be observed to be deflagrating through the duct, with the highest temperatures at the centre of the flame.

Temperature Contour

Pressure Contour

Overpressure at x=4.325
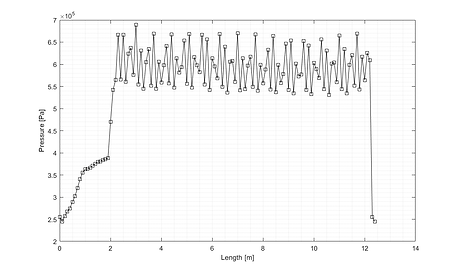
Maximum Overpressure along the Duct
Pressure
A pressure front was observed during the reaction which was due to the rapid speed at which the flame front progressed. This high-pressure region is known as the overpressure. The overpressure is clearly visible as the red section in the contour plot.
There was no direct comparable data for the overpressure values available for the HYCOM mc026 experiment. However, data for a similar experiment was available. We determined that if our overpressure values were similar profiles and magnitudes to the similar experimental data, then our results would be reasonable. We found that our overpressure result at x=4.325m was comparable to this data therefore our results were acceptable.
The maximum overpressure values were measured over the whole duct. The overpressure was rising until it reached 2.25m where the overpressure value fluctuated around 600kPa. The dramatic drop in overpressure at the end of the duct is related to the fact that the monitor is placed very close to the wall.
H2O Production
Water was produced in areas to which the reaction had spread and in these areas the hydrogen was being consumed. The hydrogen was reacting with the oxygen to produce water as expected.
Before we carried out this simulation, we calculated the mass fraction which we would expect to obtain using stoichiometric calculations. We predicted a mass fraction of 0.094 and our simulation obtained a value of 0.095. This validates our model as these values are extremely close. This also proves that we have simulated the correct chemical reactions.

Water Production Contour
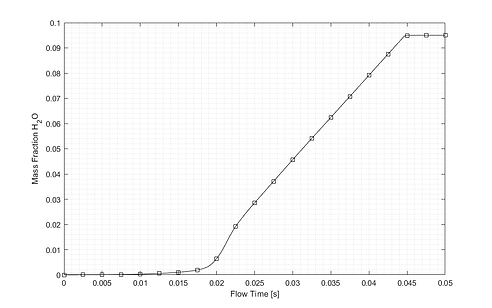
Water Production Graph

Flame Velocity Graph
Flame velocity
The flame velocity was measured as this was a key piece of data which the team had acquired for the HYCOM mc026 experiment. The average flame speed which we obtained through our simulation was 436.7m/s after 3m compared to 546.9m/s measured from the practical experiment. The team determined that our simulation gave accurate enough results and comparing them to the experimental data validates our flame velocities.
Mach number
It was important to study the Mach number of the flame to ensure that we were simulating hydrogen deflagration. As deflagration is defined as subsonic combustion, the Mach number should always be below 1 during the simulation. The average Mach number was found to be around 0.8 which confirmed that deflagration had been successfully modelled.

Mach Number Graph

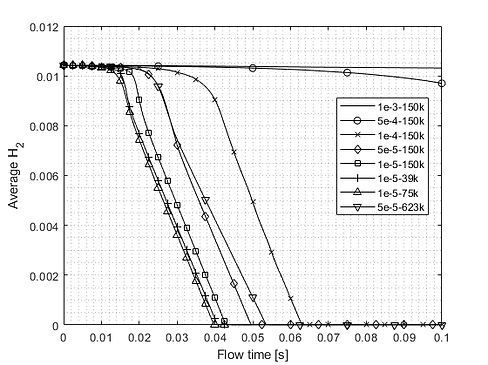
Mesh and Time Step Sensitivity Analysis on Consumption of Hydrogen
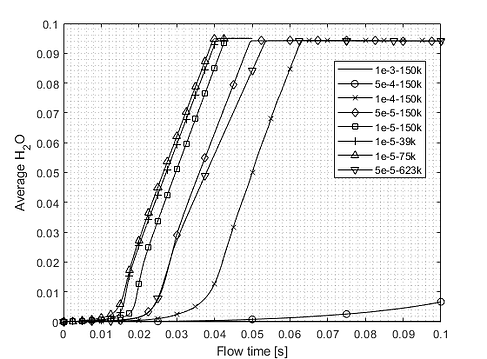
Mesh and Time Step Sensitivity Analysis on Production of Water
Validation of Results
It was extremely important that our results were validated, otherwise they would be meaningless.
Through comparison to available experimental data on flame velocity and overpressure, our results were successfully validated.
We also carried out a mesh and time step sensitivity study to check that our choices for these parameters in the simulation were accurate. We tested different mesh and time step combinations and the effects that this had on the production of water and consumption of hydrogen.
From these graphs it can be observed that changing the mesh did not have as much of an effect on results as changing the time step. The results began to converge as the time step size decreased. Therefore, the final time step chosen was 1e-5 and mesh selected had 39k elements.