top of page
Geometry
the CFD simulation

HYCOM mc026 Geometry

Our Geometry created in Solidworks
Geometry
The geometry was modelled based on the description of HYCOM mc026. This geometry is a 12.2m long duct with a diameter of 174mm, baffles at regular intervals, a blockage ratio of 0.6 and 40% venting at the opening.
The model was created to be axisymmetric about the x axis in order to reduce computational time, so half of the HYCOM mc026 geometry was modelled using SolidWorks. SolidWorks was chosen over ANSYS Design Modeller because the pattern function could be utilised to easily create multiple baffles.
Mesh
Mesh
The mesh was generated in ANSYS Fluent meshing. Extreme care was taken in selecting a mesh which was optimum for this geometry as this has great effect on the accuracy of results.
A detailed mesh sensitivity study was carried out which experimented with refining the cell size at the walls. This refinement didn't increase the quality of the results. The final mesh selected was one with a 5mm element size over the whole geometry which gave an element number of 39k and node number of 42k. The mesh consisted of quadilateral cells.

Simulation Parameters

SIMUlation Parameters
Parameters were continuously experimented with throughout the development of the model. Finding the correct parameters was the main challenge of our project.
The project SUSANA guide to best CFD practices was refered to throughout the development of the CFD model to help us create an accurate simulation.
The simulation was a transient species transport model utilising the finite rate/ no TCI turbulence chemistry interaction model. A realisable k-epsilon turbulence model was also selected. A Chemkin import file was used to describe the reactions in the simulation. The air mixture was assumed to be a compressible ideal gas and a time step of 1e-5 was utilised to run the simulation.
Challenges
A key challenge of this project was the sensitivity of results to parameter changes. Progression was slow as the simulations took between 8 and 48 hours to run.
The spark ignition technique was one of the main parameters which proved to be difficult to model. As the chemical reaction in the simulation relied on an accurate ignition it was important that we solved this. Utilising the ignition function in Fluent gave inconsistent results; when the spark was moved from x=0m to x=0.7m it became large and cold eventhough the spark settings were kept the same. Instead, the final model included a small region at the spark location which was patched to 2000K in order to ignite the hydrogen.
Initially, the team used the hydrogen-air mixture that was default in Fluent but we found that this wasn't including as many reactions as would be occuring in a real hydrogen combustion reaction. A Chemkin model was used instead of this as it included reactions between radicals and, therefore, more accurately simulated the model.
The simulation was producing inaccurate pressure results along the duct until the gas mixture was changed from being incompressible to a compressible ideal gas. This small detail greatly affected our results.
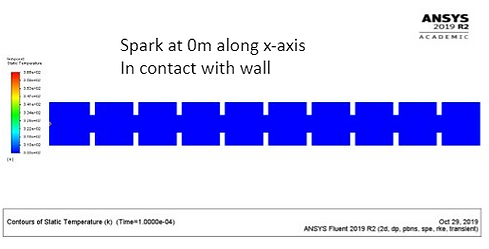


Spark from patched region.
Challenges
The Final Simulation
This animation shows the temperature contour of our final simulation. The deflagration of hydrogen along the length of the duct can be observed.

Data interpretation
The team had to carefully interpret the data generated from the simulation to confirm that hydrogen deflagration had been successfully modelled.
Monitors were set up along the length of the duct to measure the time at which the flame reached each point and this was interpreted to give the flame velocity throughout the simulation.
It was necessary to measure the flame velocity, overpressure, temperature, water production & mach number throughout the reaction to confirm that the simulation was accurate. The interpreted data was compared to published data to validate the model.
Data Interpretation
bottom of page